
Last week, a reader emailed me a chart from Visual Capitalist and one simple question: “Rachel, how bad is our housing market, really?”
I’ll be honest — I didn’t have an answer until I went digging. So I pulled up the Dallas Federal Reserve’s database, which tracks housing prices and incomes for most developed countries going back to 1975. I update this data regularly to see how inflation-adjusted home prices and inflation-adjusted disposable income have moved over the past 50 years or so.
The chart that sparked this email looks at the home price-to-income ratio across countries around the world. It’s a simple number: how many years’ worth of average income would it take to buy an average home?
Here’s what it shows:
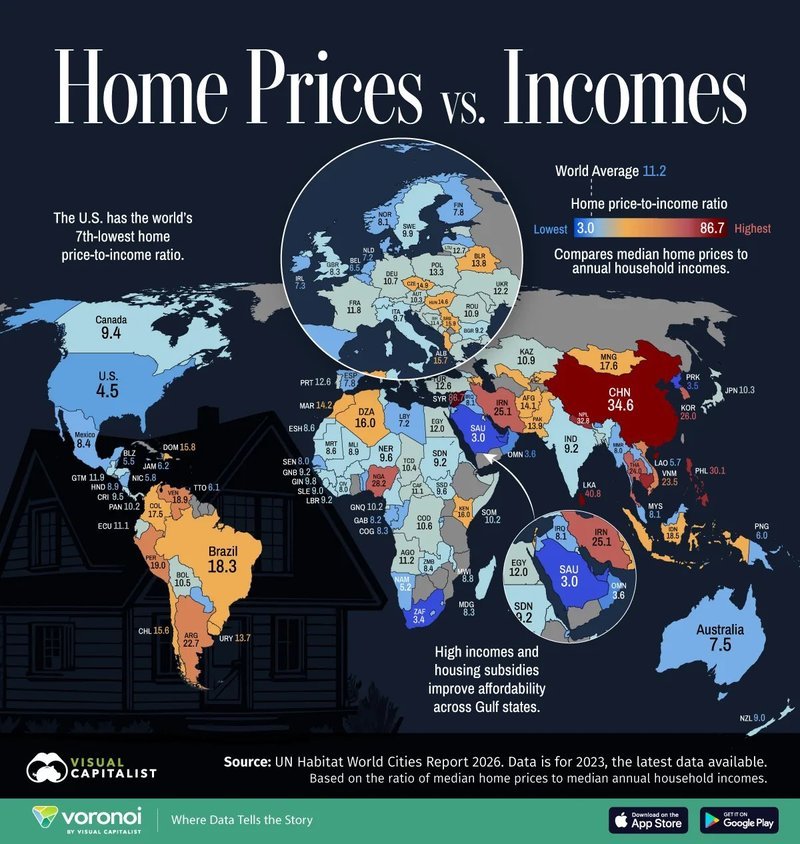
One thing jumps out immediately: housing is more expensive in most other parts of the world. In fact, the U.S. has the 7th lowest price-to-income ratio on the planet.
I know. I felt the same “really?” when I first saw it.
How bad is it, actually? Here’s 50 years of data
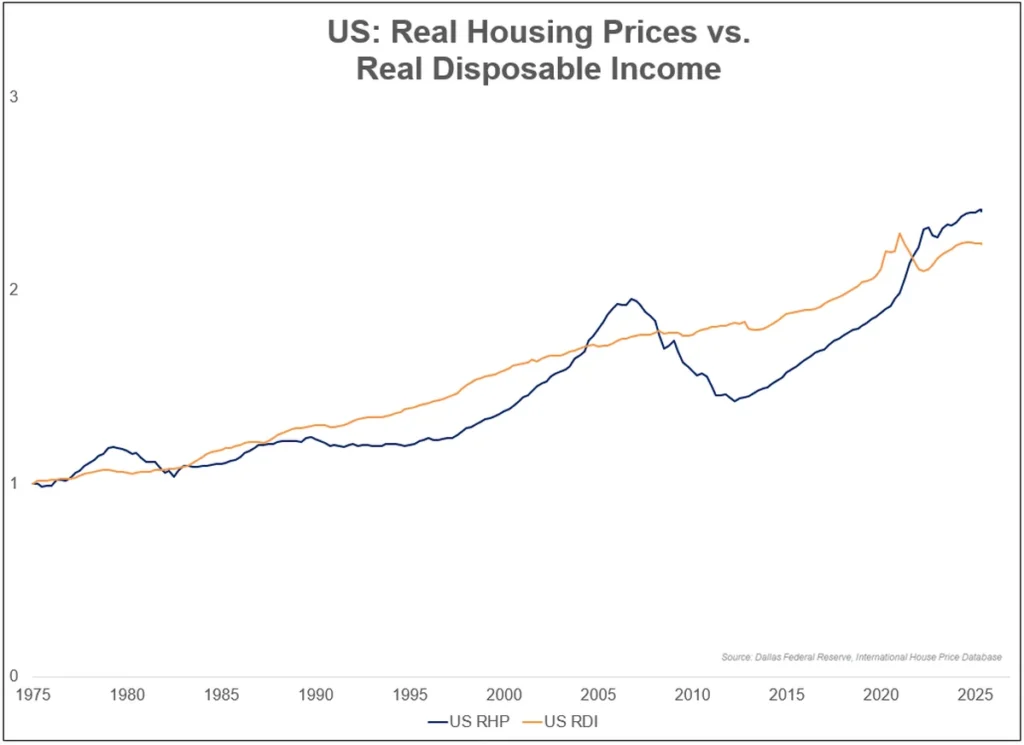
The Dallas Fed data lets us track real (inflation-adjusted) housing prices against real (inflation-adjusted) disposable income over roughly 50 years. Here’s the latest update for the United States:
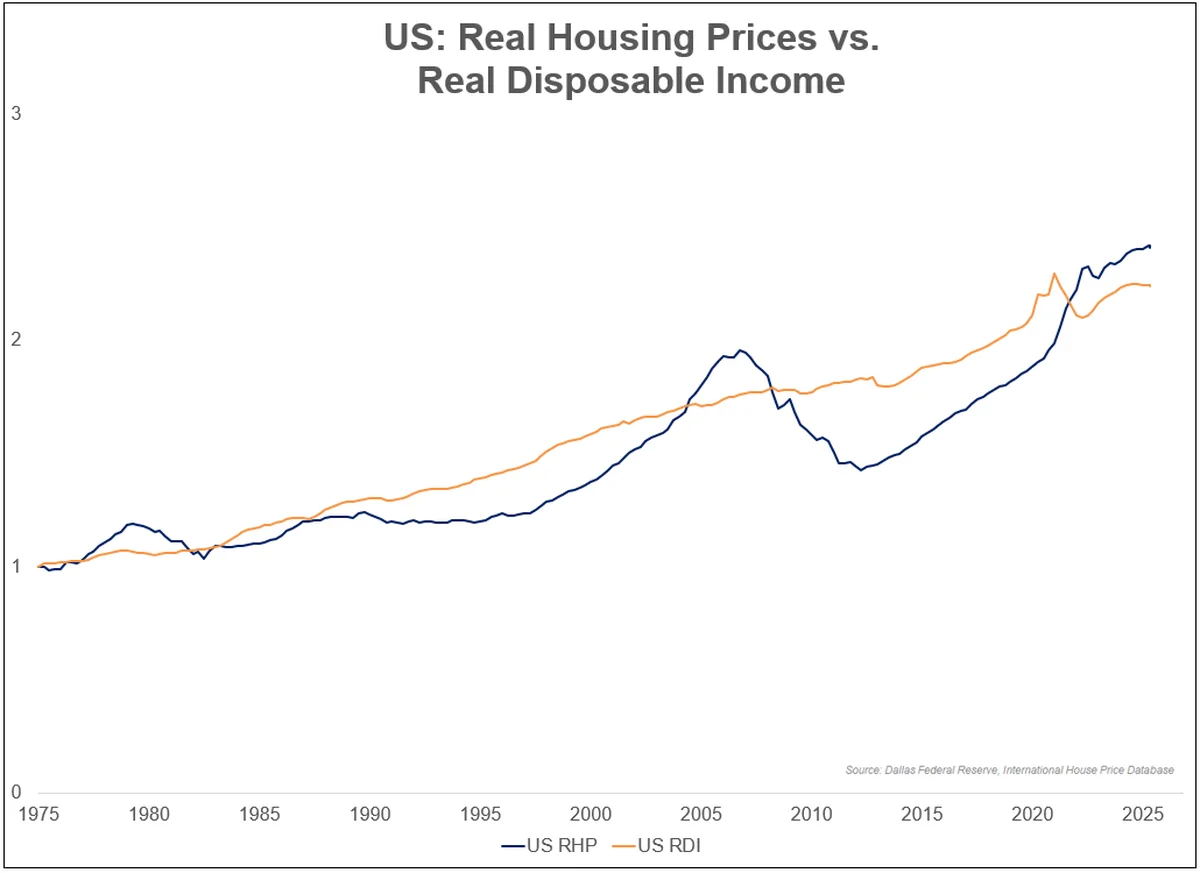
For most of that 50-year stretch, real home prices and real incomes have moved together — sometimes prices ahead, sometimes income ahead. But there have only been a few periods in which home price growth clearly outpaced income growth.
We’re in one of those periods right now.
That’s the uncomfortable part. It’s not that housing is expensive in absolute terms — it’s that it’s expensive relative to what people actually earn.
How we compare to the UK, Canada, and Australia
To put that in perspective, here’s the same chart on the same scale, adding the UK, Canada, and Australia:
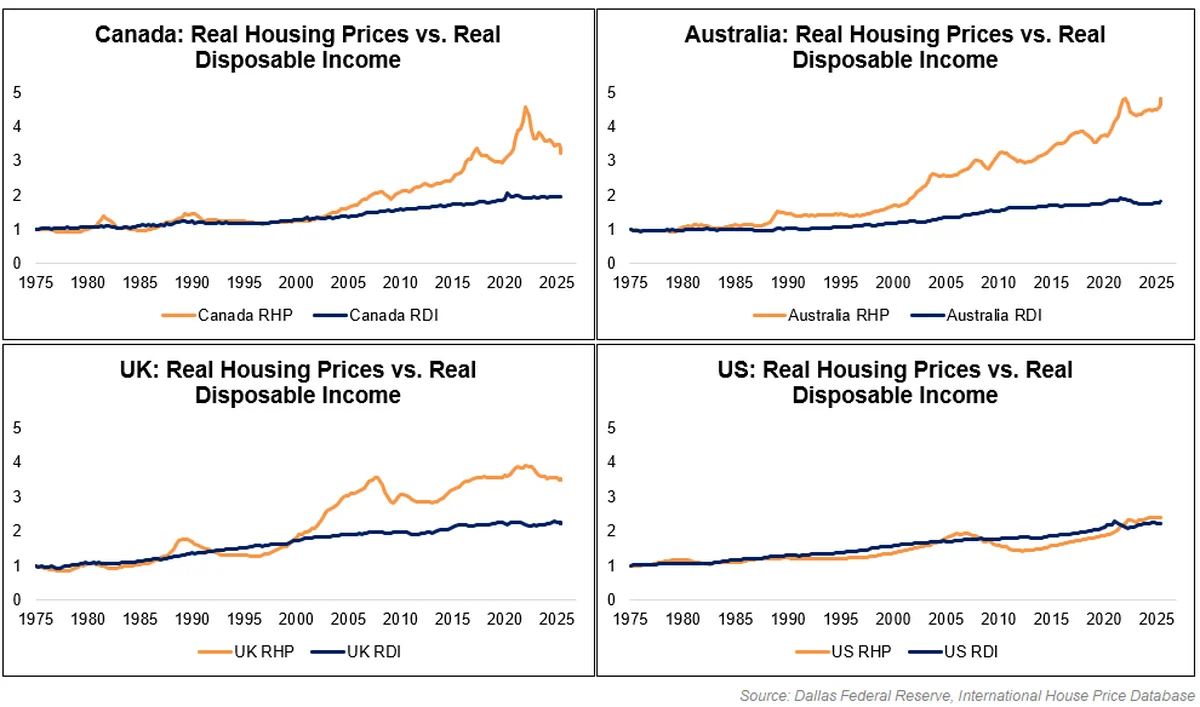
Affordability is much, much worse in those three countries. I honestly can’t imagine what it must be like to be a young homebuyer in Australia right now — and I say that as someone who still complains about our own market.
Now, none of this makes you feel better if you’re trying to buy a house in America. Who cares what the rest of the world pays if you’re the one struggling to afford a home here?
What this actually means for your plan
Three things to keep in mind before you start (or pause) your home-buying plans:
Housing is local, not national. These are nationwide averages. Your actual experience depends entirely on where you live, how much you earn, and how much supply there is in your specific market. A “7th lowest” national average can still mean an unaffordable house on your street.
Affordability can get worse before it gets better. Maybe mortgage rates will fall and that will help. But if we don’t do something about housing supply, we could end up on the same path as Canada, Australia, and the UK — where unaffordability is even more severe. Until we build more homes, until baby boomers start passing their houses down, or until income growth clearly outpaces price growth, affordability will likely stay strained in many markets.
Your timeline is your own. If you’re a young buyer who missed the last big housing bull market through no fault of your own, that’s real — and it’s okay to grieve it. But your plan doesn’t have to match someone else’s. Work with what you have: your income, your savings, your tax situation, and a realistic budget.
This post is for general information and is not professional financial or tax advice. Your situation is unique — do the math for your own life before you decide.
Here’s your one small action today: pull up the Dallas Fed’s housing data for your specific state and compare it to your local income. If the gap is bigger than you expected, write down one number you can actually control — your monthly savings target, your down payment pace, or your budget ceiling — and commit to it for the next 90 days. You don’t need to fix the whole market. You just need to fix your own numbers.
慢慢来。财务自由是一笔一笔攒出来的,房子也一样。