

Over breakfast last week, my husband slid a numbered newsletter in front of my coffee: The 2026 Medicare Trustees Report is out. And below the fold, in smaller print: Hospital Insurance trust fund to be depleted by 2033.
“So we’re broke by 2033, then?” he asked.
I laughed, because I’ve learned the hard way that scary one-line numbers are almost never the whole story. I spent the next two hours reading the full report — and here’s what it actually says.

The headline date is real. But it’s also a distraction.
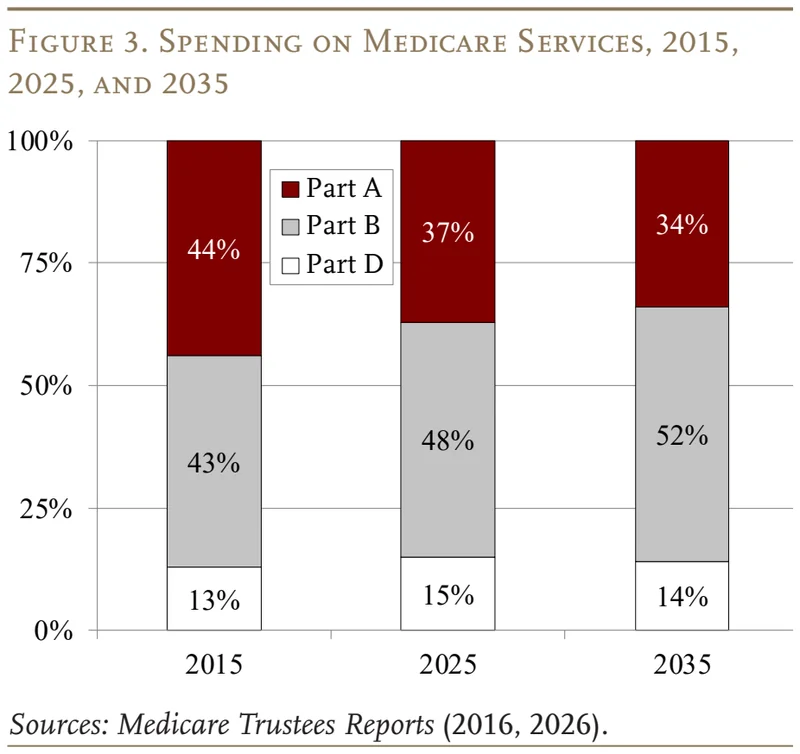
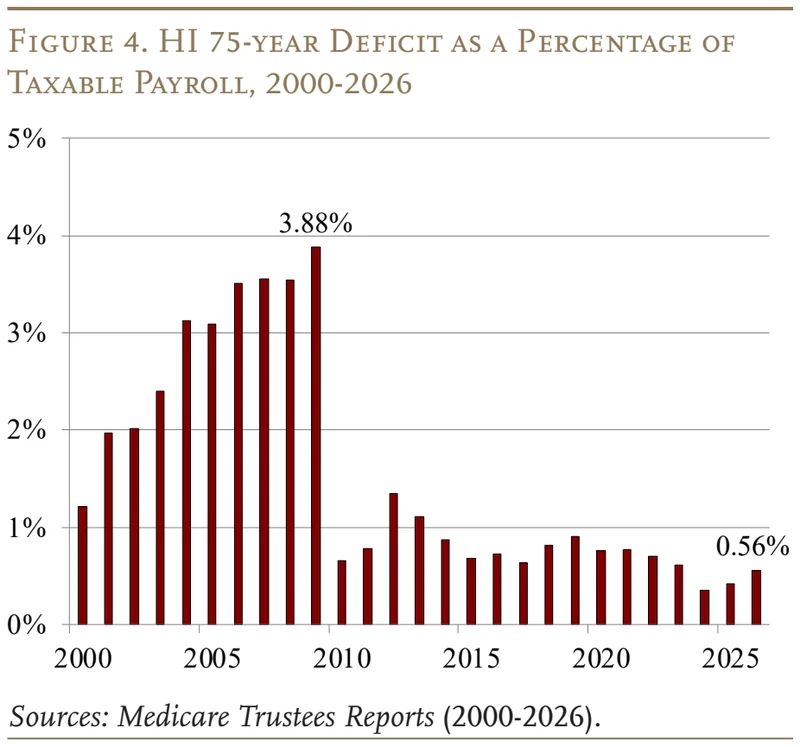
The section about the Hospital Insurance (HI) fund is the one that makes the news, but HI is just 37% of Medicare spending today, and that share is falling. By 2033, maybe 2034 if it gets worse, the dedicated HI fund will be tapped out — similar to Social Security, of course — at which point it can pay about 89% of its bills in 2033 and 87% in 2034. That’s a gap worth watching, but the actuarial deficit for the full 75-year period is 0.56% of taxable wages in 2026. You could close it with a 0.28-point payroll tax hike (from 2.9% to 3.46%). It’s a number, not a cliff.
The number that scares me more: total Medicare spending will exceed Social Security spending in 11 years — and by 2100, Medicare will be 7.5% of GDP versus Social Security’s 6.7%. And that’s even after the ACA cost controls are baked in.
What Medicare actually is (in kitchen-table language)
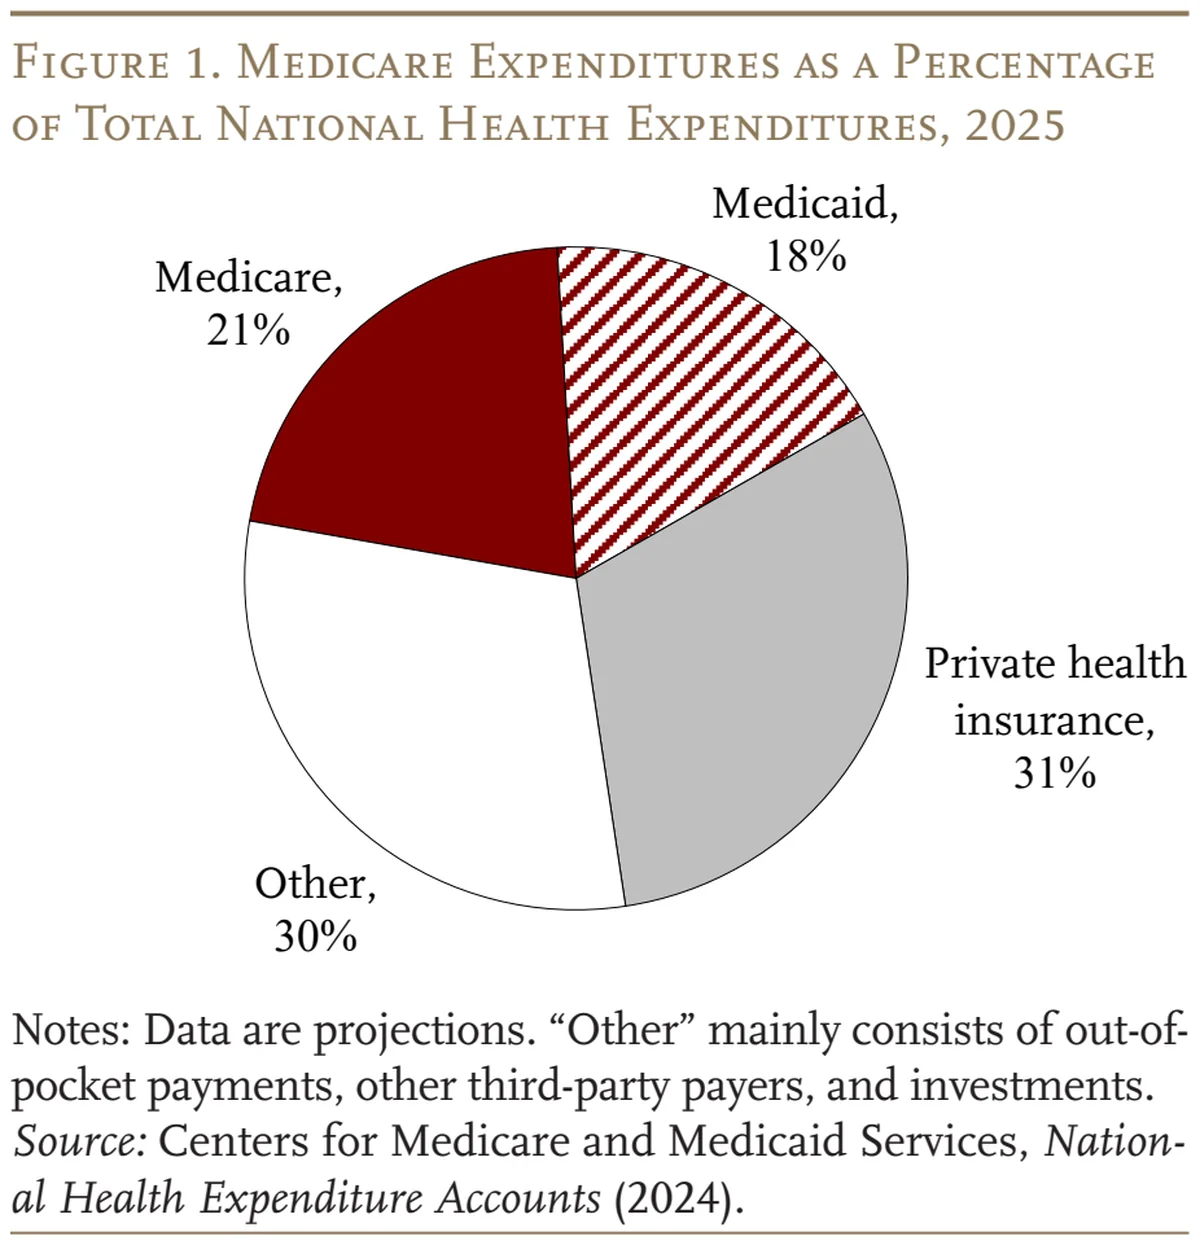
Let me do a quick orientation so the numbers below make sense. Medicare covers virtually all Americans over 65, plus some disability recipients. It spends 21% of the nation’s total healthcare spending and 14% of the entire federal budget — that chart is below, and I’d recommend looking at the actual slices rather than just the labels.
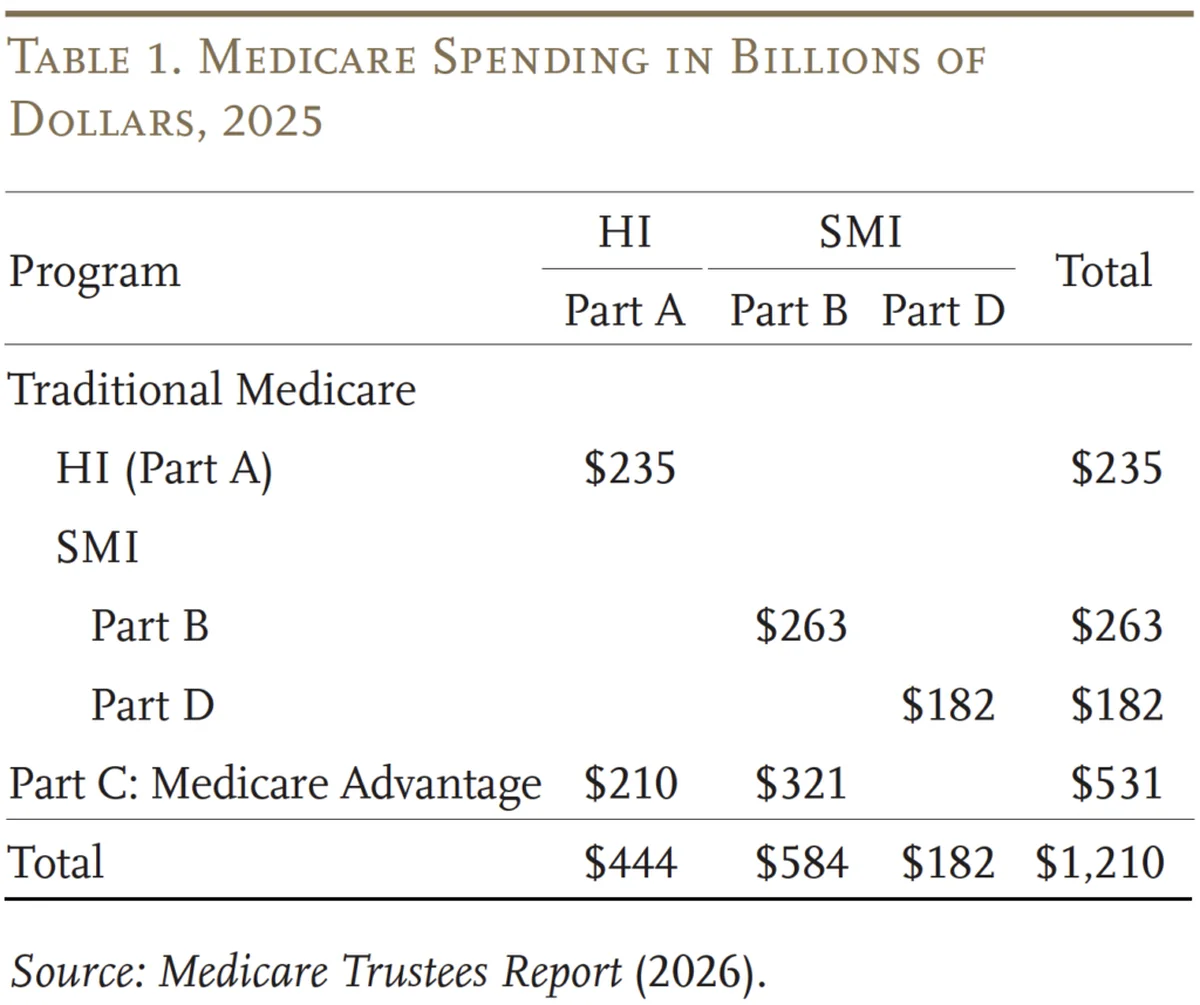
Traditional Medicare has three parts. Part A is the hospital stuff — inpatient stays, skilled nursing, hospice. Part B is doctors and outpatient care. Part D is prescription drugs, added in 2003. Then there’s Part C, Medicare Advantage — the private-plan wrapper that must cover at least Parts A and B, usually D too. Advantage now covers more than half of new enrollees, and in 2025 carried about 44% of total Medicare spending.
How the money comes in matters, because each part has its own wallet. Part A is mostly funded by a payroll tax — 87% of its revenue, split evenly between employer and employee. High earners pay an extra 0.9% on wages above $200k single / $250k married — and because that threshold isn’t indexed, more of us cross it every year. Parts B and D lean on general revenue — 73% and 81% respectively. Translation: when Parts B and D costs rise, it doesn’t hurt a dedicated tax fund. It draws from the federal budget, which means your taxes, your premiums, your children’s taxes.
The fund that isn’t running out — and the fund that sort of is
Here’s where it gets interesting, and it broke my brain a little. The official Trustees’ projections assume the ACA’s cost controls on hospital and physician reimbursement will hold. Under that assumption, Part A’s 75-year deficit is small, and Parts B and D never technically run out of money because general revenue fills the gap every year.
So why write a book about it? Because Medicare’s own actuaries wrote a second set of projections under the assumption that those cost controls eventually break. And under that scenario, Medicare’s total cost is 9.8% of GDP by 2100 versus 7.5% under current law — 2.3 points of GDP of hidden extra cost, driven mostly by Part B (and, to a lesser extent, Part D, which is up because of GLP-1 and specialty drugs).
That 2.3-point gap has been the headline for years, and it hasn’t gone away, but it’s also wearing thin: the current-law and alternative projections have converged over the last few years. The picture is worse as a whole, but less diverging than before.
Why Medicare is expensive: it’s not the generosity, it’s the price tags
My first instinct when I read the section on why Medicare costs so much was surely the benefits are avalanching. Turns out not. Traditional Medicare covers less than most private plans — limited mental health benefits, no cap on out-of-pocket for hospital stays or doctor bills either. So you’re not paying for a gold-plated package.
It’s that health care in the US is just expensive. US healthcare costs are about twice the OECD average, and the difference is in doctor salaries, drug prices, and admin costs — not in Americans using more care. One chart from the report sticks with me: by 2025, Medicare pays hospitals only 55% of what private insurance pays for the same services, and doctors 64%. If that keeps sliding, providers may stop taking Medicare patients, Congress will be forced to pay more, and the gap extrapolates out to 2042 and beyond.
And here’s the part that’s hardest to swallow in the kitchen-table conversation: we’re one of the few countries that don’t cover its under-65 generally, has a lower life expectancy than the OECD average, has higher infant mortality — and even 65-year-old life expectancy is below the OECD average. For what the numbers say we’re paying, that’s awkward.
The one line I’m taking to retirement planning
Before I get my mother-in-law on the phone, here’s the bullet. Medicare Advantage costs 14% more per person than traditional Medicare, according to the Medicare Payment Advisory Commission. Why? Three quirks in the payment formula: Advantage plans code more health conditions, they get enrollees who are actually healthier without fully discounting for it, and the quality payout bonus top-dresses it some more.
So the entire problem isn’t one thing. It’s one expensive system, plus one overpayment channel, plus cost controls that may not hold. The Trustees say it has been 10 years straight since the annual funding warning went out, and nothing has happened.
What does this mean for your budget? Same as it did for mine: nothing you can fix at the individual level today, but things you should start planning with rather than hoping around:
1. Don’t let the 2033 headline rush your decisions. HI is 37% of spending. If you’re enrolling in Medicare now, the choice that matters most for years ahead is Advantage vs traditional, not which quarter the trust fund runs dry.
2. Before you sign anything, ask about the premium and the out-of-pocket cap. Many Advantage plans pair zero or low premiums with a cap, which is a real trade against traditional Medicare’s lack of a cap. My Wealth Planner’s rule of thumb: know what you’re actually buying.
3. Budget for Part B and D premiums to keep going up. That’s in the projections whether or not the fund runs dry. If you’re HSA-eligible now, that’s the one tool in your 401(k)/Roth IRA stack that’s designed for exactly this. Talk through tax implications with your planner before you pick sides.
4. Sleep on the 2033 gap differently from the Social Security one’s. In 2033, HI could cover about 89% of the bill, 87% in 2034. That’s an annual negotiation Congress has to be in — a vaccine-like event. It’s worth someone in your household paying attention. Do one of this year’s, give the full text to your partner, put it on the calendar for next year, and you both feel the same number.
That’s the report. It’s not a doom scenario. It’s a pipeline of tradeoffs we all get to see before they happen.
If you do only one thing today: pull up the full 2026 Trustees Report on CMS and read the funding warning section. It’s on page one. It’s been on page one for ten years in a row. Spend ten minutes on it — then you and I will both be watching the same number at dinner.