
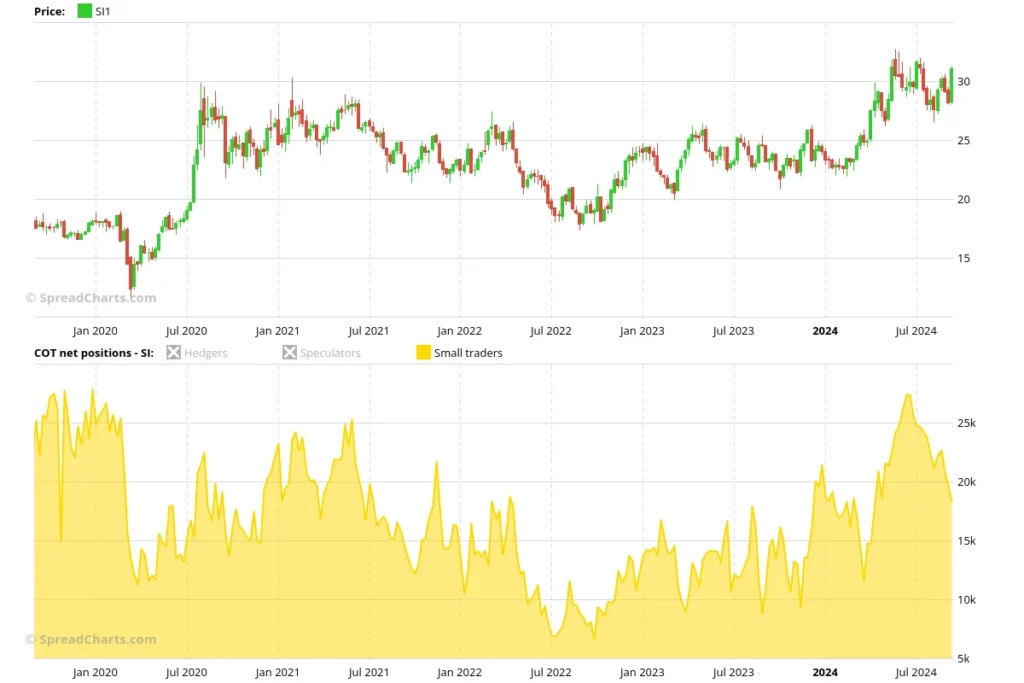
My husband once told me that when he looks at a retirement account statement, it feels like looking at a celebrity poster — visually impressive, emotionally distant. I get that feeling with most market data too. But there’s one dataset that finally stopped reading like noise and started sounding useful.
It’s the small traders’ section of the Commitments of Traders report, or COT. And SpreadCharts just made it easy to track.
The data that was always hiding in plain sight
I’ve used market data long enough to know the rule: if something is already there and nobody’s looking at it, someone smarter than me has a reason for paying attention. Tom McClellan — a well-known analyst — uses this small traders’ series regularly for silver and other markets. I started wondering what everyone else was missing.
The COT report breaks down futures positions by trader type: large institutions, big speculators, and then the rest — non-reportables, which are usually retail traders. These small players can’t move the market on their own. But when they pile into one side together, it tends to signal something.
Think of it like this: if everyone in a room is crowding toward the same exit door, you might want to check whether that’s actually where you need to go.
Where to find it
You can access the small traders’ data under the COT net positions or COT net position index in the SpreadCharts app. There’s no net traders data for this group, but the net position view alone tells a story worth reading.
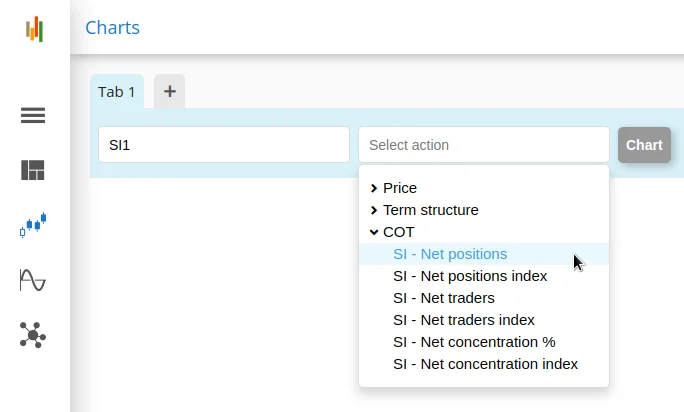
The app doesn’t force you to look at it — I appreciate that. The whole point of good analytical tools is not to drown you in charts but to surface what matters. SpreadCharts has always resisted adding every feature users ask for, and their motto — “less is often more” — shows here.
Silver: where small traders actually make noise
This data works best in markets driven by retail enthusiasm. Silver is the classic example.
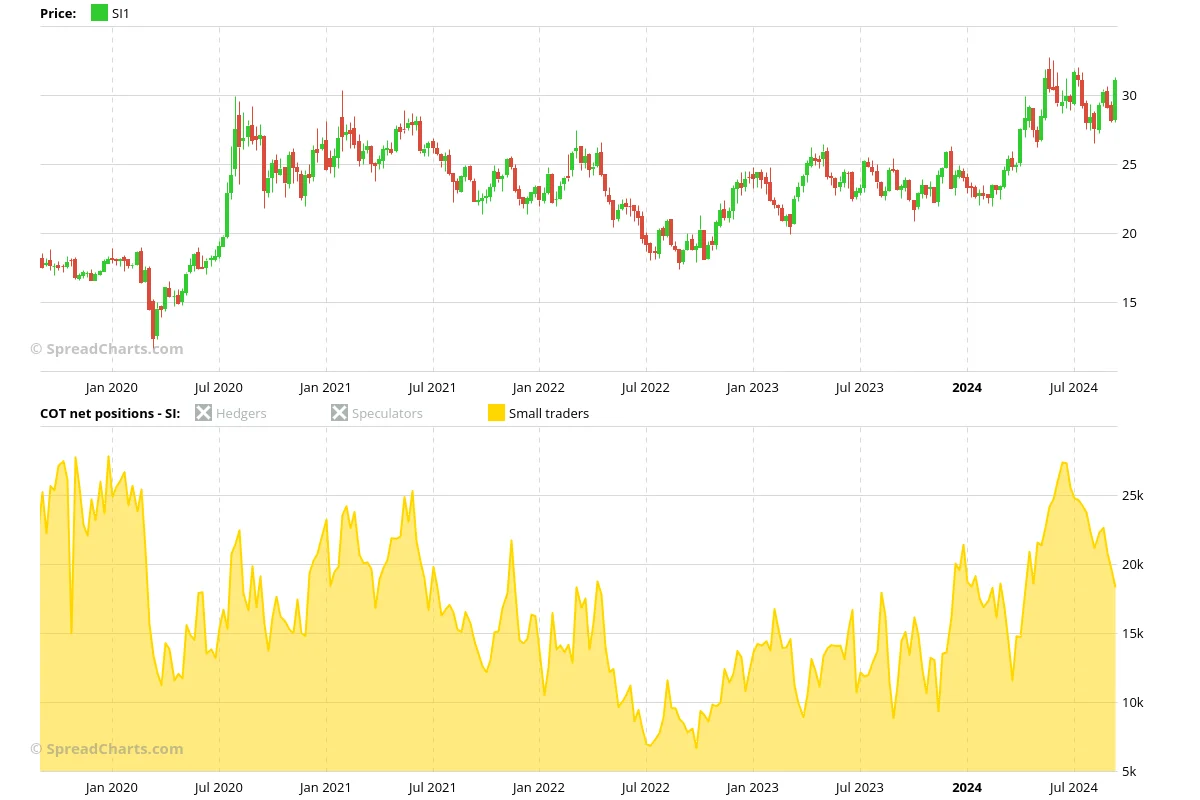
Small traders swing from one extreme to another — fully long, then suddenly all short. That kind of positioning whiplash is a sentiment gauge. When everyone is already on one side, there’s nobody left to push prices further in that direction.
I’m not saying you should blindly bet against the crowd. But if your instinct says “buy” and the small traders are already maxed out long, it might be worth pausing and asking why you disagree with them — or agreeing faster than usual.
Crypto: the poster child for retail frenzies
Bitcoin and Ether on CME micro contracts offer another great testing ground. We already track large speculators’ net positions in these markets, but small speculator data adds a different angle entirely.
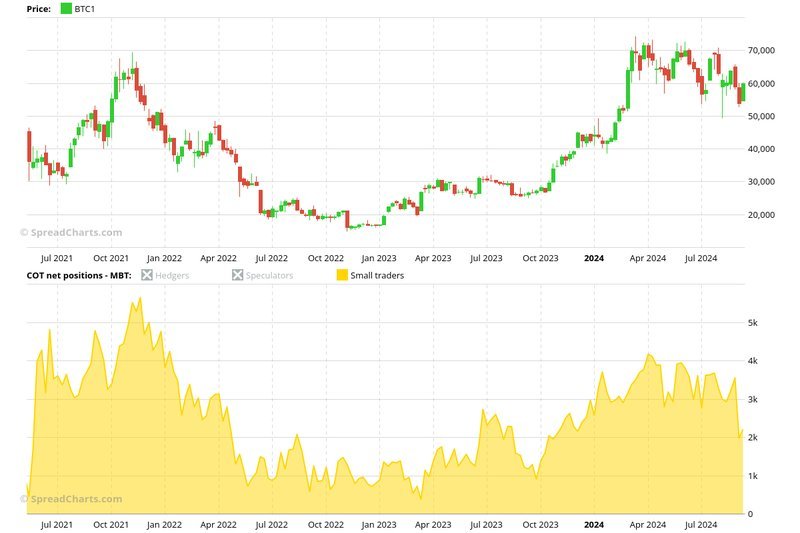
Cryptocurrencies are where retail frenzies happen fastest and loudest. The small traders’ COT data can show you when the frenzy is building — and when it’s already priced in.
What to do with this today
You don’t need a premium subscription to start exploring. The new data is available in both the free and premium versions of SpreadCharts. If you recently updated, just press Ctrl+Shift+R to fetch the latest version.
I’d suggest picking one market you actually trade — or think about trading — and spending ten minutes scrolling through the small traders’ net positions over the last year. Look for those extreme swings. Ask yourself what was happening in that market at those moments.
You won’t find a crystal ball in this data. But you might find something simpler: a reason to slow down when everyone else is speeding up. That alone is worth more than most indicators I’ve chased over the years.