

The first Sunday in January, my husband and I sit down at the kitchen table with coffee and last year’s tax return spread between us. It’s not a meeting with an agenda — it’s more like checking our financial pulse. We call it our annual review, and we’ve kept it simple on purpose.
My husband once asked if this actually changes anything. I told him: you don’t need a GPS to know you’re off the highway. This review is that check.
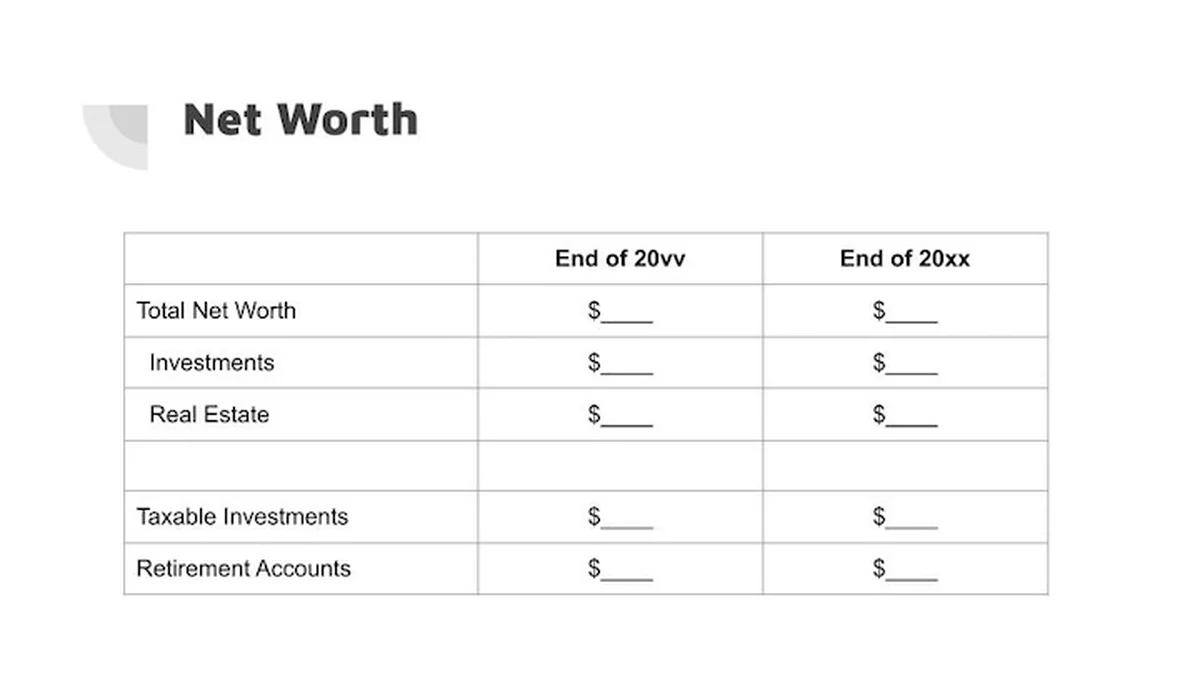
1. Net Worth — Two Numbers Are Enough

We start with total net worth, broken into two buckets: liquid investments (what I call “paper assets”) and real estate. For the house, we subtract any mortgage balance from what it’s worth.
Here’s the rule that saved me hours of stress: round to the two most significant digits. $1.3 million or $250k is good enough. I used to obsess over every hundred dollars. Now I don’t even look past that.
We split liquid investments further into taxable accounts and retirement accounts — and yes, you can add a third slice for Traditional versus Roth if that helps your brain organize things.
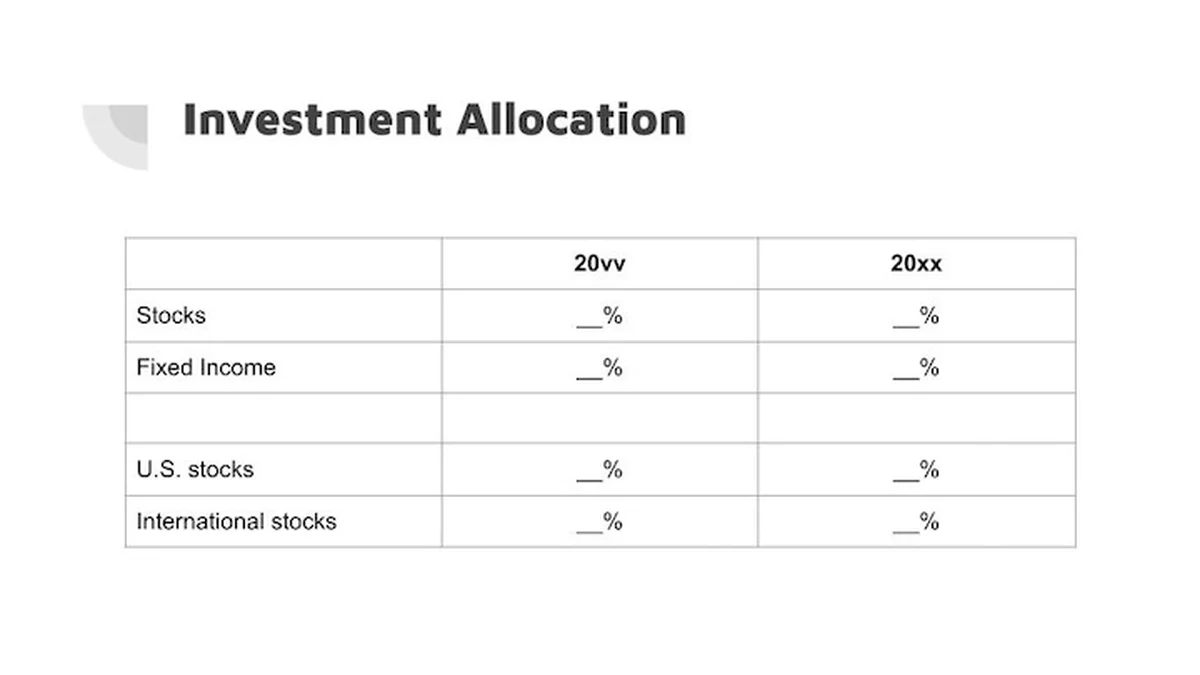
2. Investment Allocation — Where Your Money Actually Lives
Next we look at the big picture: stocks versus fixed income, and U.S. stocks versus international. This tells us two things — how our allocation shifted from last year, and whether we need to rebalance.
We pull these numbers from Fidelity’s Analysis feature, which examines holdings across all accounts in Full View. Fidelity Full View + Analysis You can use any tool or a simple spreadsheet here.
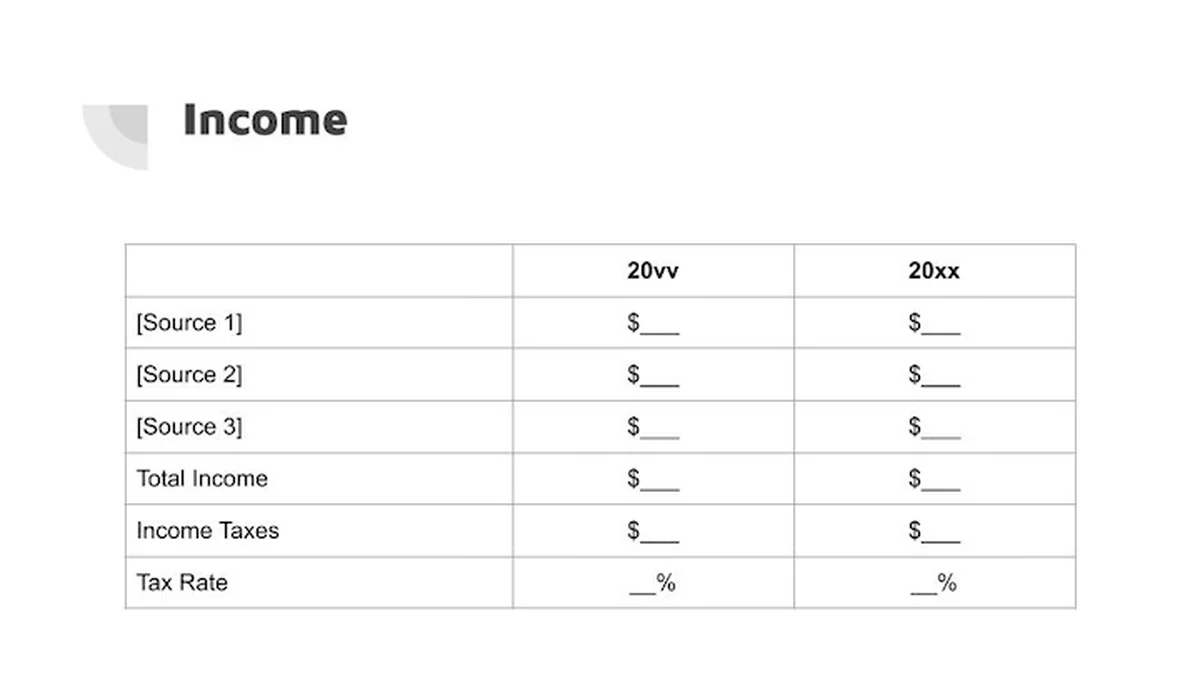
3. Income and Taxes — The Year in One Line
This is our tax return boiled down to its simplest form: What are the major sources of income? How much did we pay in taxes? And what’s that as a percentage of total income?
We track income numbers in Microsoft Money — yes, it was discontinued years ago, but it still runs fine on Windows 11. Tax figures come from actual federal and state returns for the prior year, and estimates for any year just ending.
Again: two significant digits only. $25k, not $24,736. The extra precision gives you a false sense of control, and I learned that the hard way.
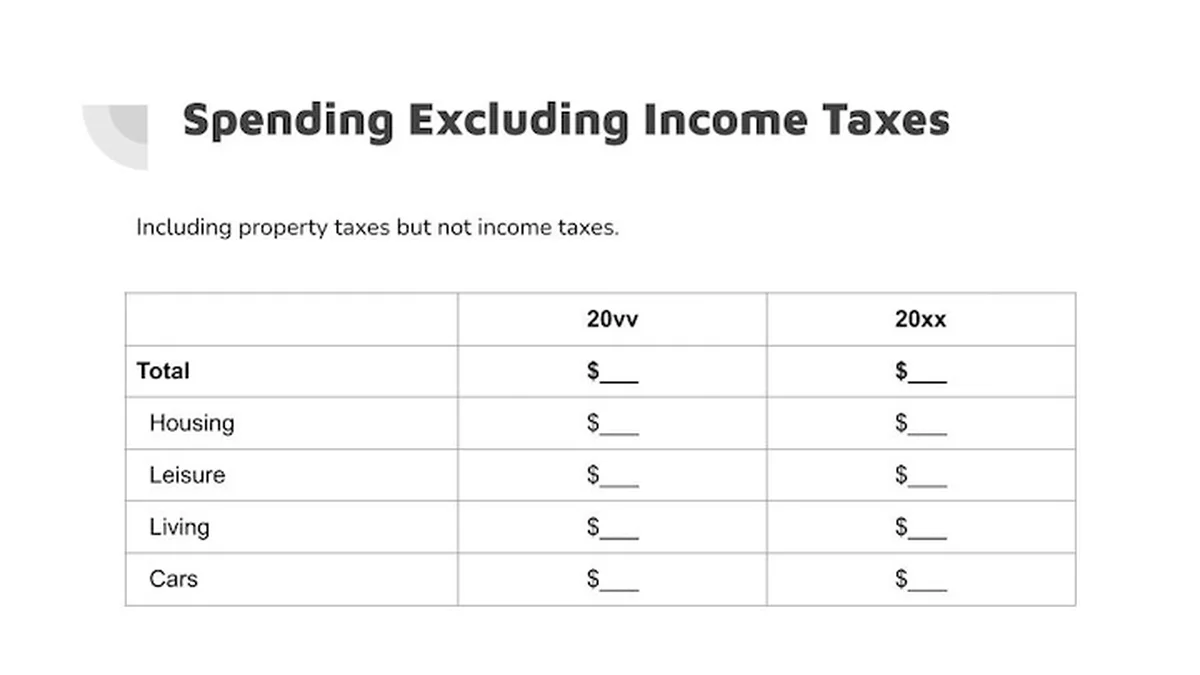
4. Expenses — Three or Four Categories Max
We include property taxes but not income taxes in our expenses. Income taxes are already covered above, and they’re mostly a function of how much you earn.
The key here is keeping categories to three or four major groups. Fewer categories mean fewer distractions. When I tried tracking 14 expense categories last year, I stopped caring by February.
5. Retirement Projections — The Optimistic Run and the Stress Test
We run a baseline projection in Fidelity’s retirement calculator using accounts assigned to our retirement goal. Fidelity Retirement Planning Tool The calculator uses our best guesses for income, expenses, and major life events.
Then we run it again — in my husband’s account this time, with a more pessimistic set of assumptions: lower income, higher expenses, unexpected events. Fidelity doesn’t let you save two scenarios in one account, so that’s our workaround.
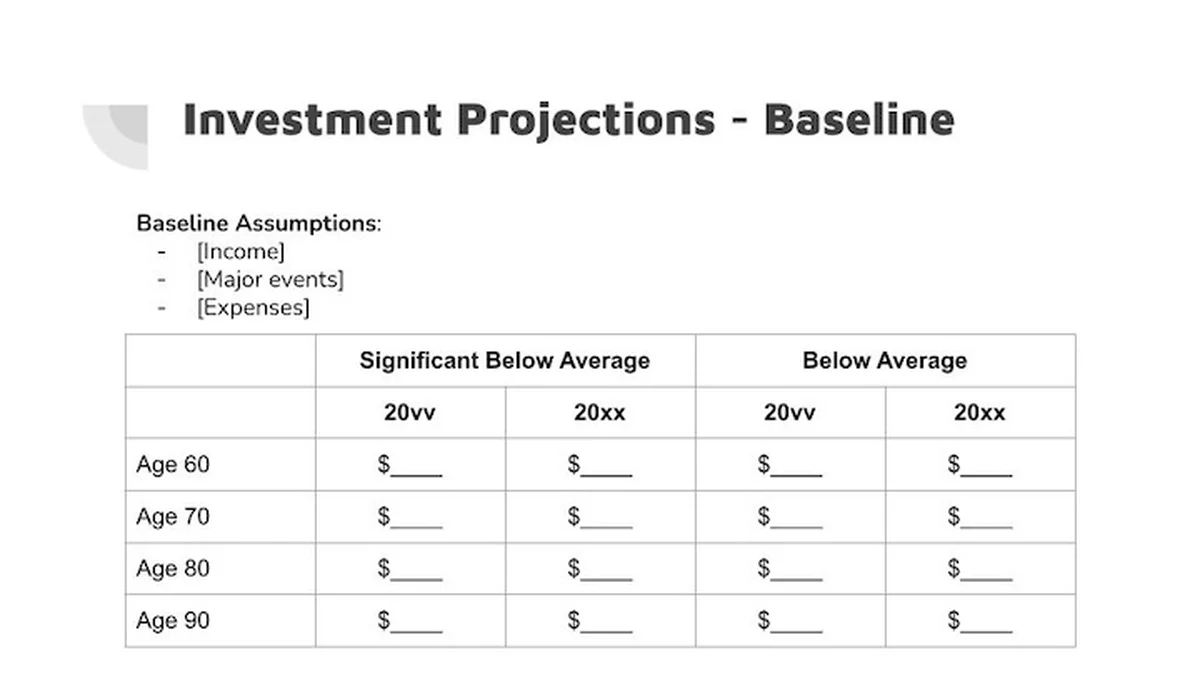
The pessimistic run is the real value here. It’s a stress test for your future outlook. What if your best guesses are off? We want a plan that survives bad conditions, not just good ones.
Why Keeping It Short Matters
We intentionally keep this review short and simple because the big picture is what actually guides decisions. When you zoom in too far, every number looks like a problem.
Projections are educated guesses by definition. Anything beyond the single most significant digit is noise. Comparing this year’s numbers with last year’s tells us whether we’re on track — and that’s enough.
Your Turn
If you find this format helpful, you can download the template from Google Drive. It’s set as view-only — just use File → Download to save it in PowerPoint or ODP format and make it your own.
Sit down with your partner this week, grab last year’s tax return, and start with just one number: what’s the total? The rest will follow. Slowly but surely, these numbers become friends instead of strangers.